Courses: Quantitative Reasoning, Elementary Statistics, Functions and Modeling, and Precalculus for ENG-PHYS-CS Course Type: Corequisite Math Pathways Quick Stats: The percentage of students completing college-level math in a single semester rose from 29% to an average of 73% per term, showing steady, lasting improvement. When surveyed, 100% of students enrolled in a lab (corequisite) course said it helped them succeed in their math class. Background & Overview Seminole State College (SSC) math faculty sought to redesign their math sequence to help students graduate on time and place them into math pathways most relevant to their fields of study. In fall 2017, the Mathematics Department launched corequisite math pathways in Quantitative Reasoning, Statistics, and STEM tracks. Within just a few semesters, SSC transitioned to a 100% corequisite model across all math courses. Placement & Course Structure Students are placed in a pathway based on their major, so they can learn the most applicable mathematics for their future careers. Placement into a corequisite course is determined by ACT math scores, QAS Accuplacer results, and a Multiple Measures Rubric to ensure students receive the level of support they need. * STEM includes Precalculus for ENG-PHYS-CS and Functions & Modeling Each pathway pairs with a credit-bearing course immediately followed by a lab (corequisite) course that provides targeted lesson content and individualized support. With this model, students receive one-on-one help immediately after learning new material, reinforcing mastery and confidence. Corequisite remediation is also offered online, where intentional communication and targeted math review are integrated directly into the course design. Results & Student Impact With this new model, more students are passing their credit-bearing math courses within their first year, increasing overall retention and graduation rates. “The lab class (corequisite) helped me so much. I was able to get one-on-one help on questions I needed help with. The extra class was the reason I was able to pass with an A.” -Isaac H., Seminole State College student “Special Topics (corequisite course directly following the credit-bearing math course) really helped me grow as a student! Being able to head to Special Topics after learning a new objective was very helpful because I was able to receive one-on-one help from the professor. It was a class that definitely gave me the confidence to succeed in college! “ -Bryce F., Seminole State College student
![]()
November 11, 2025
Courses: Quantitative Reasoning, Elementary Statistics, Functions and Modeling,...
Read More
Dr. Korey Kilburn teaches mathematics and leads the Aeronautical Sciences program at PennWest University–Edinboro. He stays very busy outside of the classroom as he also teaches jiujitsu, is a pilot, serves as a Hawkes Faculty Consultant, and is a former college wrestling athlete. Recently, Hawkes had the opportunity to learn more about Dr. Kilburn’s journey as an instructor and is delighted to shine a spotlight on his passion for mathematics. Read along to learn more about Dr. Kilburn’s experience as a Hawkes instructor! Dr. Kilburn teaches the following courses with Hawkes Learning’s materials: Calculus I, II, and III — Calculus with Early Transcendentals, 2nd Edition College Algebra — College Algebra, 3rd Edition Essentials of Calculus — Essential Calculus with Applications, 3rd Edition Precalculus — Precalculus, 3rd Edition Elements of Statistics — Beginning Statistics, 3rd Edition Statistics and Data Analysis — Discovering Statistics and Data, 3rd Edition While Dr. Kilburn originally attended PennWest University–Edinboro as an undergraduate wrestling athlete, he then pursued three advanced degrees, including his Ph.D. in Mechanical Engineering and Applied Math. He attributes his pursuit of higher education in math to his mentors, Mrs. Judy Scaletta and Dr. Anne Quinn. He shared that Mrs. Scaletta, his 12th grade math teacher, helped him realize he had a knack for the subject. Dr. Anne Quinn taught him in his undergraduate math courses at PennWest University–Edinboro and helped him realize all the opportunities available to him in pursuing a graduate degree in mathematics; they are now colleagues at PennWest–Edinboro. As a first-generation college student, Dr. Kilburn said that he truly appreciated Dr. Quinn’s guidance in exploring the opportunities a future in mathematics could provide for him. Dr. Kilburn’s experience as a former college athlete is applied in his classroom as he reminds his students to continue to show up and work hard in their pursuit of educational success. He reminds them that education is about the big picture, explaining, “It’s not a sprint, it’s a marathon.” Dr. Kilburn teaches a wide array of mathematics courses, ranging from College Algebra to Statistics and Data Analysis to Differential Equations. Dr. Kilburn explained, “Each semester, I look at my schedule, and if there is a corresponding Hawkes textbook I can use for my courses that semester, I will use Hawkes each chance I get.” He was initially introduced to Hawkes during an initiative to bridge the gap for incoming students who had weaker backgrounds in algebra. He enjoyed using Hawkes because of the friendly, timely support he and his students received, Hawkes’ mastery approach, and the HawkesTV video library provided to students. “I think Hawkes and I just get along well; I can implement it into my classes very easily and seamlessly, and the students are happier. I’ve noticed a lot of improvements just since I started using Hawkes,” he explained. Dr. Kilburn uses the Hawkes Sync Tool to link his Hawkes courses with his learning management system, Brightspace. He also utilizes an inclusive access model to distribute his course materials to his students so that they can have access to the Hawkes student platform on the first day of class. When asked his top reasons for returning to Hawkes each academic year, he replied, “The customer service, in general, is through-the-roof amazing. One thing I like about Hawkes is how quickly they help. Not only do they help, but they also really walk you through it. They’ll do everything to make sure you understand.” He continued, “I feel a lot of support there. I don’t feel like I’m just some number,” as he described Hawkes’ Support Team as a friend who genuinely wants to help you. When asked what advice he’d give to an instructor considering adopting Hawkes’ materials, he replied, “First, I would highly recommend it. Secondly, I would say not to be afraid to reach out and ask questions.” He has observed that his students really appreciate the straightforward structure that the Hawkes “Learn, Practice, Certify” sequence provides to them. He also enjoys how easy Hawkes makes it to customize, grade, and manage his courses within the instructor platform. Dr. Kilburn has noticed positive trends since switching to Hawkes in his courses. He explained that when he made the switch to Hawkes in his courses, he did not change his final exams, nor did he change his approach. He said that he noticed both grades and student morale improved, and he believes that is due to the Hawkes approach, which leads to true mathematical understanding. Dr. Kilburn is gifted with the ability to see mathematical applications all around him, from his car tires’ coefficient of friction to an airplane’s rates of ascent and descent. He hopes to help his students see the same applications and relevance of mathematical subjects. This is especially considered when it comes to his calculus sequence courses. He teaches Calculus I through Calculus III with Hawkes’ Calculus with Early Transcendentals. Calculus can be intimidating, so Dr. Kilburn tries to remind his students that mathematics builds upon itself and that the heart of calculus is actually algebra. He appreciates that Hawkes provides students with not only thorough content within the textbook and courseware but also comprehensive free instructional videos to bring the concepts to life. Dr. Kilburn believes that helping students make the connection of mathematics at work around them can be a motivating factor, expressing, “It’s really all around us. We have to just be aware of it.”
![]()
May 27, 2025
Dr. Korey Kilburn teaches mathematics and leads the Aeronautical Sciences...
Read More
Professor Kathie Lennertz teaches her Math 250 courses at Fort Hays State University with Hawkes Learning’s Discovering Statistics and Data, 3rd Edition materials. Before Hawkes, my students would not do enough homework to be able to master the material. They would just make a quick pass at the assignment and move on even though many would have a section score like “2 out of 14 correct.” This contributed to a poor homework score, which frequently led to a poor exam score and a poor course grade. Something had to be done to compel students to spend more time, effort, and attention to actually being able to learn concepts deeply enough to correctly solve a wide range of problems. Also, my students need course materials and technical support that take into account the needs of fully online students, most of whom are working adults. "The mastery-based assignment certification is a game-changer." I set mine to 80%, which requires a strong performance from the student without the burden of perfection. Having the relevant section materials right there in Learn gives them easy access to the book while they are working on problems. In addition, the Practice section has an amazingly large set of problems. This is especially good for difficult concepts like the Central Limit Theorem. Practice makes better, and the students need to practice. Most of the concepts are strange and new to them, so having lots of directed practice with concept-based feedback and the new AI-generated tutor is necessary. This puts the student in charge of his or her own learning, which will be a huge help to each of them later in life. They also benefit greatly from an excellent book written by a statistician like Dr. Hawkes. Statistics is a separate subject from mathematics with its own nomenclature. The book includes a large number of real-world examples from many different areas of human life. Since my students come from many different programs of major study, it gives each of them examples and problems of the sort they might find in their profession. The students demonstrate FAR greater engagement in the course. They dig into the concepts, and most are able to apply the material to their own lives. Most seem more satisfied with their course experience. I also get a lot fewer complaints about the course and some more compliments. The grades in my classes are higher too. Thus, fewer students have to repeat the course. My department likes that, the students like that, and I like that. Everybody wins. The Hawkes system helps my students learn better and have greater success in the course. They go through less “agony” during the semester. The system and I have become partners in helping students learn. The awesome customer service is a real benefit to me and my students. We know that the reps and tech staff are there for us.
![]()
February 18, 2025
Professor Kathie Lennertz teaches her Math 250 courses at Fort Hays State...
Read More
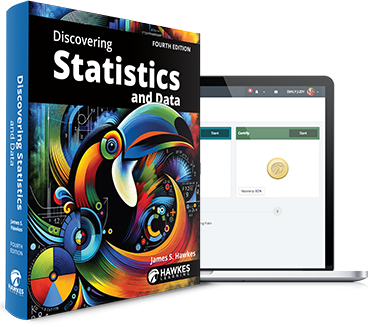
We’re thrilled to announce the release of the 4th Edition of Discovering Statistics and Data! This latest edition represents a significant evolution in statistical education, carefully crafted based on valuable feedback from instructors across the field. Explore the Full Table of Contents Discovering Statistics and Data is intended for an introductory statistics course and is written in a relaxed, conversational style, with occasional remarks that are intended to both engage and bring a smile to the reader. The fourth edition of Discovering Statistics and Data by James Hawkes presents important concepts and techniques in a straightforward, step-by-step manner and is suitable for both STEM and non-STEM majors. A Deep Dive into What’s New Enhanced Core Content The 4th edition introduces strategically rewritten and new content that strengthens the connection between empirical thinking and statistics. Notable additions include comprehensive lessons on Inference about Two Population Variances and ANOVA Post-Hoc Multiple Comparison Procedures, providing students with essential tools for advanced statistical analysis. Real-World Applications Statistical concepts transform into practical understanding through application; that’s why this edition includes: 50 real-world data sets (a 67% increase from the 3rd edition!) carefully integrated throughout the textbook and readily available for download Fresh case studies and vignettes that demonstrate statistical concepts in action More than 100 new and updated examples in the instructional content with detailed solutions that reinforce statistical thinking and problem-solving skills Expanded Learning Resources To further support diverse learning preferences and provide comprehensive practice opportunities, we’ve added: 300+ new and updated exercises designed to develop advanced problem-solving capabilities and multivariable thinking 350+ new software questions have been added, expanding our question bank to over 1,600 unique, pre-written questions for homework and assessments Enhanced solution guides that walk students through complex problem-solving processes Each update in the new edition was carefully chosen to support both instructors and students in their statistical journey. This comprehensive update reflects our commitment to providing the most effective tools for statistical education. By integrating empirical thinking with practical applications, we’re helping students develop not just statistical knowledge but the critical thinking skills needed for real-world data analysis. Ready to Explore? Experience these enhancements firsthand! Contact us to request demo access to the student experience of the 4th edition today.
![]()
February 12, 2025
We’re thrilled to announce the release of the 4th Edition of Discovering...
Read More
Highlights & Overview: Of students who passed the course, 100% scored 70% or more on the homework. Of students who passed the course, 91% scored 80% or more on the homework. For students who received less than a C, their average homework score was 55.56%. Of students who failed the course, the average homework score was 31%. For students who earned a final grade of 90 or better, their average homework score was 99%. This case study explores the link between time invested in homework and overall course success. By analyzing the homework scores and final grades, we can identify significant patterns that underline the importance of consistent homework performance. Background & Context This study analyzes Dr. Herb Baum’s use of Hawkes Learning’s course materials at Guilford College during the Spring 2024 term. Dr. Baum uses Hawkes’ Beginning Statistics in his Math112 Elementary Statistics course which is facilitated in a lecture format. He has been using Hawkes’ materials since 2018 to administer his homework lessons, midterms, and final exams. He also utilizes Hawkes’ Canvas synchronization option, providing an easy grade transfer portal while also streamlining the student sign-in process. When asked about his favorite Hawkes features, Dr. Baum reports Hawkes’ renowned Customer Support Team and the intuitive Practice mode in the student platform. Dr. Baum also shares that Hawkes’ grading system in the Instructor Platform has been very beneficial. This study was conducted with the assumption that students must have a C or above to “pass” the course and move on to the next course. At Guilford College, a “C” is equal to or greater than a final grade of 72. A final score of 55 or below indicates a failing grade in the course. With Dr. Baum’s custom course settings, students receive 100% for submitting their Certify assignments on time, 75% if it is up to two weeks late, and 0 thereafter. Data Highlights MATH112 Hawkes Product Used: 3rd Edition Beginning Statistics This scatter plot demonstrates a strong positive correlation (R² = 0.7975) between students’ homework scores and their final grades. The upward trend indicates that higher homework performance is generally associated with better course outcomes, especially with higher homework scores. Additional data analysis beyond this graph further illustrates a clear relationship between homework completion and overall success in the course, providing more detailed insights into performance thresholds and grade distributions. Homework Performance and Passing the Course 100% of students who passed the course scored 70% or more on their homework. 91% of students who passed the course scored 80% or more on their homework. Homework Performance and Lower Grades Students who received less than a C had an average homework score of 55.56%. Students who failed the course had an average homework score of 31%. Homework Performance and High Achievement Students who earned a final grade of 90 or better had an average homework score of 99%. Analysis While correlation does not necessarily equate to causation, the data demonstrates a strong trend between performance in Hawkes’ homework lessons and overall course success. Students who passed the course consistently achieved higher homework scores. The fact that every student who passed the course scored at least 70% on their homework highlights the critical threshold necessary for passing. High achievers (those earning 90 or better as a final grade) nearly perfected their homework, with an average score of 99%, indicating that top students not only complete their homework but excel in it. This is a clear reflection of Hawkes’ mastery learning approach at work. When completing a Hawkes homework lesson, the student has the opportunity to truly master the learning objectives, leading them to become test-ready. Conversely, students who received less than a C or failed the course had significantly lower homework scores, averaging from 31% to 55.56%, respectively. This suggests a clear link between poor homework performance and overall academic achievement. Conclusion The evidence presented strongly supports the notion that dedicating time and effort to homework is a key factor in academic success. Ensuring students understand the importance of homework and providing innovative interactive homework opportunities could significantly improve their overall performance in the course. The more time that students interacted with Hawkes Learning’s mastery pedagogy, their overall grade was positively impacted.
![]()
Embarking on my educational journey with Hawkes has been a game-changer, and I’m excited to share my observations about the features of this courseware that have been crucial to my success in the classroom. As a committed user of the platform and Hawkes Student Ambassador, I’ve had the honor of delving into several platform features that have improved my educational experience. The Practice Test feature has been a game-changer in my exam preparation. I was able to recreate actual exam settings and identify my areas of weakness by customizing practice exams. This feature helped me feel less nervous about the test and gave me significant guidance about what to focus on during my study sessions. The Learn mode and Practice mode are two more intriguing features that have helped me to solidify my grasp of the course material. Practice mode provided limitless application possibilities, while Learn mode allowed for in-depth topic reviews. I was able to review difficult ideas at my own pace because of the flexible and encouraging learning environment that was created by the inclusion of options like Skip and Tutor in Practice. I believe in staying organized and that is the key to academic success, and the notification feature on Hawkes proved to be a reliable companion. Because it highlighted important tasks according to their due dates, it helped me stay on track. This function helped me organize my time so that I never missed a deadline and continued to be proactive with my academics. Hawkes provides more than study materials. The Practice Tests provide personalized performance overview charts, displaying an all-encompassing assessment of my progress. Additionally, after each Certify session, a Certify Review would provide a visual picture of my performance and opportunity to review my question attempts. By examining these resources, I was able to spot patterns and concentrate on the areas that need more care, which enabled me to make improvements over time. These particular aspects of the platform have been crucial to my academic success, and my experience with Hawkes has been transforming. My overall learning experience has been enhanced by the platform’s dedication to customization and flexibility, while also providing me with the resources I need to succeed. Looking back on my academic journey, I can see that Hawkes has been a dependable teacher who has helped me achieve academic success. I am excited to share my success with fellow students and encourage them to leverage these features for their academic wins. "Hawkes has been a dependable teacher who has helped me achieve academic success." Meet the Author: Lakshmi Nikhitha Tellakula, an MBA student at the University of North Texas specializing in Business Analytics, is recognized for her unique blend of analytical prowess and business acumen. With a focus on enhancing student experiences through data-driven insights, she aspires to become a senior business analyst post-graduation. Actively engaged in campus activities such as the Asian Student Association, and Public Relations Club, and serving as a Volunteer Social Media Coordinator, she demonstrates dedication to both academic and extracurricular excellence. In her leisure time, she finds enjoyment in playing chess and badminton, reflecting her varied interests. Lakshmi served as a Hawkes Student Ambassador throughout the spring 2024 semester. If you’re interested in learning more about Hawkes Learning’s Student Ambassador Internship Program, please click below: Hawkes Student Ambassador Internship
![]()
June 28, 2024
Embarking on my educational journey with Hawkes has been a game-changer, and...
Read More
To begin with, creating a comfortable and supportive learning environment is crucial in helping students feel more at ease with assessments. This involves establishing a classroom culture that emphasizes respect, inclusivity, and the value of every student’s perspective. I believe in fostering a positive classroom culture where students feel safe to express their thoughts and ideas, regardless of whether they are right or wrong. This sense of psychological safety is essential, as it allows students to take risks in their learning and not fear making mistakes. This encourages open communication and reduces the fear of judgment, which can contribute to test anxiety. When students know they can share their ideas freely and receive constructive feedback, it alleviates the pressure to perform perfectly. Among the strategies discussed in the article, the concept of “low stakes assessments” particularly appeals to me. The idea of frequent, low stakes assessments can help students become more familiar with the testing process, reducing the pressure of high-stakes testing. By breaking down the testing experience into smaller, more manageable parts, low stakes assessments demystify the process and make it feel less intimidating. This approach also allows for immediate feedback, which can help students identify and rectify their mistakes in real-time. In turn, this continuous learning cycle promotes mastery and confidence in the subject matter. However, implementing this strategy requires careful consideration. While it may be effective in reducing test anxiety, it also raises questions about the validity and reliability of the assessments. We must balance the benefits of reduced stress with the importance of maintaining the integrity of the educational outcomes. If the stakes are low, students might not be as motivated to prepare thoroughly for the assessments. Therefore, it is essential to strike a balance between maintaining the integrity of the assessments and creating a low-pressure environment for students. This might involve setting clear expectations, providing meaningful feedback, and emphasizing the formative nature of the assessments. In terms of what I am willing to try with my students, I am open to the idea of incorporating more formative assessments into my teaching practice. These assessments, which provide ongoing feedback and allow for continuous learning, can help students overcome test anxiety by breaking down the testing process into manageable parts. By focusing on the learning process rather than just the end result, formative assessments shift the mindset from fear to growth. Moreover, I believe in the power of mindfulness and relaxation techniques in managing test anxiety. Techniques such as deep breathing exercises, progressive muscle relaxation, and guided imagery can help students stay calm and focused during assessments. These practices cultivate a state of mindful awareness, allowing students to engage with the material in a clear and focused way rather than being distracted by anxious thoughts. In conclusion, while test anxiety is a significant issue in education, it is not insurmountable. By adopting a combination of supportive learning environments, low stakes assessments, and mindfulness techniques, we can help our students feel more confident and less anxious about assessments. It’s about creating an educational landscape where growth, resilience, and lifelong learning are the priorities, rather than just focusing on high-stakes outcomes. About the Writer Professor Chambliss received his undergraduate degree from Huntingdon College and obtained his masters degree from Alabama A&M. Neal has taught high school since 2008, and has been teaching as an adjunct since 2015. He began adjunct teaching first at Kennesaw State University’s Paulding campus and then began teaching at Calhoun Community College in 2022.
![]()
May 30, 2024
To begin with, creating a comfortable and supportive learning environment is...
Read More
Introducing Olcay Akman, a dedicated educator with over 25 years of partnering with Hawkes Learning. Dr. Akman is a professor teaching introductory statistics and beginning calculus courses, where he has seamlessly integrated Hawkes’ resources to enhance student learning. With a passion for teaching and a commitment to student success, he emphasizes flexibility and compassion, ensuring each student has the opportunity to thrive. Our Customer Experience Coordinator Victoria Kelly was excited to get the chance to interview Dr. Akman to explore the roots of his educational passion and the valuable lessons he’s acquired along the way. *Interview responses have been lightly edited for content and clarity. What courses do you teach with Hawkes Learning? I teach an introductory statistics course. My wife is also a professor; I introduced Hawkes to her when she taught Calculus and she agreed to use Hawkes for her calculus class, so basically, I teach both Stat and Beginning Calculus using Hawkes’ Beginning Statistics and Essential Calculus titles. Our offices are next to each other, she’s Dr. Akman too. Today when I told her that I was going to meet with you, she asked me to tell you how happy she was that I got her into Hawkes for Calculus. I’ve shared Hawkes with every institution I went to. I joined Illinois State in 2004 and introduced Hawkes which is still used in our Math 150 course, Fundamentals of Statistical Reasoning. I designed the whole course based on my experience with Hawkes prior to when I had joined ISU. I actually taught at the College of Charleston for a while, and so after I introduced Hawks to ISU, several instructors started using it as well. Overall, how long have you been teaching? I received my doctorate in 1994, so 2024 will be my thirtieth year teaching as a Ph. D. Altogether, I’ve been teaching since 1983 in some capacity so, I would say, in total, I have been teaching for almost 40 years. Throughout the 40 years, do you have a secret to teaching that you rely on? Early in my career, I had an epiphany that students are human, too, and they are somebody’s kids. We should not treat them with an “us against them” mentality, but rather as individuals, and we should not be punitive for life getting in their way. I think that when I woke up to this fact, I felt like I became a better teacher. It sounds like that would probably be one of the most valuable lessons you’ve learned as a teacher throughout the years… Are there any other really valuable lessons and takeaways that you’ve gained throughout the years? Another valuable lesson I learned was actually from witnessing my own son in an undergraduate program. When he was an undergraduate student, I observed some of his instructors. During his struggle with some health issues, some of his professors were not accommodating. For instance, one semester he had a very severe cold that infected his lungs, and he couldn’t make one of his assignment deadlines. He requested an incomplete in the course, but the professor was very dismissive. When I observed that I took it to heart, and I adopted this philosophy that I would be as accommodating as possible to my own students. If a student calls me to say they’re sick and cannot make the exam, I am going to meet them where they are so we can form a plan together to make up the exam. It’s apparent that your compassion just flows through your teaching. That is awesome – I’m sure that your students really appreciate that. What are some of the biggest challenges that students are facing? So there are two answers to this question: you have pre-COVID and post-COVID answers. Let’s talk about pre-COVID first. I am one of the first instructors in Hawkes’ history who started using the Hawkes software as a stand-alone course. When I started in 1998, Hawkes was designed to be a supplemental resource to an existing course. When Hawkes began to position their offerings as a complete homework system, I was one of the first ones who started using it as a standalone course. Back then, this was such an original idea to Hawkes, that programming was still in the infancy stage. I was able to work closely with some of the lead developers with Hawkes to provide my feedback, and they worked very hard to accommodate my requests. When I first used Hawkes as a standalone course, the first big challenge I had was getting students to actually study. How would I get them to Certify the material themselves and attempt to learn the material without someone holding their hands? We approached this by providing lecture notes, video clips, and additional learning resources. I would regularly look at their classroom activities to see how long they had spent on the Learn module or the Practice module. Using this information, I could guide the students in how they should invest their time. Monitoring time spent and providing a few additional supportive resources seemed to work…until COVID. I think now, the generation we have in our classes is the generation that came from the COVID shutdown. They seem to have trouble independently solving problems, which requires a different approach than “Please watch this clip and then come to my office hour, and I’ll help you.” Quite honestly, I don’t think I have found the solution to this problem yet. I am interested in research that studies this phenomenon – education articles that study the long-term impact of COVID on education. And as a side note, since I was the very first one who started using Hawkes as an online standalone course, I went to local mathematics meetings, JSS meetings and other educational meetings to share with our Math and Statistics community how Hawkes is so effective. I used to go to many conferences on Hawkes’ behalf to introduce the idea of the Hawkes Learning experience, but I think now the idea caught up! I am an organizer of a conference that is in biomathematics and ecology, education, and research (the BEER Conference). This is the second biggest biomathematics conference in the United States since the biomathematics community is an interface of biology and mathematics. All of the Covid research, cancer research, global warming research – all of these are actually biomathematics. It’s a great conference! As a social activity, we even organize a soccer match between biologists and mathematicians. That’s awesome! How has Hawkes’ unique mastery approach made a difference in your courses? When I first started using Hawkes in 1998, I was at Coastal Carolina University in Conway, South Carolina. I was kind of ahead of my peers in terms of using technology. When I found out about Hawkes’ mastery approach, it was like a light bulb sparked in my head, and I am still such a proponent of that idea. Inspired by Hawkes, I use the mastery approach in most of my courses, even in my graduate courses. I am a proponent of using homework, not as a punitive tool, but rather as a learning platform. A few years ago, I had a student who couldn’t certify all the lessons by the time the exam was due, and therefore got 0 on the test. After this incident, I received an angry email from a parent regarding the situation. This allowed me to explain the concept of Certify and why I use the mastery approach, explaining that her son was not being penalized, but rather he was being held accountable for truly learning the material before proceeding with the examination. I reminded her that an exam was a test to see how much her son had truly learned, and certifications were the method to prepare him for that examination. His mother actually thanked me, and I was glad she could understand my approach to the homework process. How have your thoughts about technology in the classroom evolved over time? I know you’ve seen Hawkes go through a lot of changes! When I started with Hawkes, you had to get a physical disk from the school bookstore and install it on individual computers. Then one year, we got a server to use in our computer lab so that we could use computer software more effectively. As an early Hawkes user, I gave feedback directly to the Hawkes engineers and developers. A specific example of how they used my feedback is found in the Hawkes Grade Book chat option feature. Back then, we didn’t have Google Meet or Zoom, so we needed a chat option to quickly communicate with our students. Awesome. I think that a great testament of how we really try to listen to our customers. Right – Hawkes values customer feedback; that’s a selling point to all of my colleagues. I always tell my colleagues and my students I have never seen a better, more responsive, more prompt, more caring tech support or customer support system than Hawkes offers. Do you have a favorite breakthrough moment that you’ve experienced with the student? I had a struggling student in my class, and one day he came to my office to talk with me. He said, “You know what? I finally understood when I was certifying these assignments. I finally understood how to study and how to learn the material— I practice problems!” I checked his activities on the Hawkes report dashboard. He was really studying the material and practicing problems, and thus he would generally only need one attempt to Certify. Keep in mind that he was really struggling; now, he’s one of the most prominent computer scientists! He worked at IBM for years, and now he has his own company. He hires our students as interns. That’s my breakthrough. If I saved one student from falling through the cracks, I think I did alright. Oh, I love that story! To see how he took what he learned in his experience to be able to turn around and invest that in the next students. That’s fantastic. Thank you for sharing that! What is something that your students do not know about you? I am a college NCAA soccer referee. I am also an avid camper and an avid hiker. During the COVID shutdown, I taught some of my classes from a van that I converted into a camper on the Appalachian Trail; that’s one of the best memories of my teaching career. You mentioned earlier that you help lead the BEER conference, what are some other professional activities that you’re involved in? Yes, I am the main organizer of The International Symposium on Biomathematics and Ecology Education and Research (BEER). I also organize an undergraduate research experience workshop called The Cross Institutional Undergraduate Research Experience (CURE). I also work with the NSF REU Program. We work with undergraduate students to train them in how to conduct research from simple programming to scientific writing, to lab work if necessary. By the time these students are finished with their undergraduate degree, they are published authors which greatly improves their chances of continuing to pursue higher degrees in education. That is a project I started in 2014 that I am very proud of. Additionally, I’m the Chief Editor of Spora, the only internationally refereed student-oriented resource journal in biomathematics. Spora is very student-friendly and provides students with constructive feedback on how to improve their journal submissions, allowing students to become student authors and provide experience. I hope that the Spora journal, the undergraduate research workshop, and the BEER Conference will remain my legacy. Those are all amazing. It sounds like you stay very busy, but busy doing really fantastic things. What is your favorite thing about your campus in Normal, Illinois? Normal is a twin city to Bloomington, Illinois. Bloomington has all the best features and advantages of big cities without the cons that often come with a big city. It’s a nice Midwest town where it’s easy to raise a family. I am a big classical music buff. In a town of our size, generally, you wouldn’t find a symphony orchestra, large bookstores, a cultural concert, a ballet, etc. However, we have all of those! I would say that my favorite part of my campus is the fact that ISU is the biggest small-town university. What are you currently researching yourself, or what are you currently reading? Since 2020 I’ve been exclusively working on COVID modeling and COVID predictions. I have published extensively on this topic to the degree that some of our models in 2020 performed better than CDC’s own models. In May 2020, when the COVID-19 pandemic was still new to the US, we published a paper on COVID modeling. A newspaper interviewed me, and asked about models and I predicted August COVID mortality rates would be 170,000. On August 15, 2020, the actual COVID mortality report was 170,456. Since then, I’ve continued studying COVID-19’s impact. Initially, there wasn’t much focus on poverty and COVID-19. I became interested in researching people who live in poverty, people who don’t have access to healthcare, and people who live in states with expanded Medicare versus no Medicare. That’s a bit of what I’ve been working on during the last three and a half years. Articles by Dr. Akman: https://pantagraph.com/news/local/education/covid-forecast-models-vary-but-an-illinois-state-university-prof-who-develops-them-is-urging/article_90f182c2-abc3-5ece-8645-b57a5fbde66b.html https://pantagraph.com/news/local/education/watch-now-illinois-state-university-professor-accurately-forecast-covid-19-deaths-by-august/article_c1fdcfac-45ad-5965-a90e-2da9c5285ddc.html https://www.wglt.org/news/2020-05-18/isu-professors-models-point-to-higher-death-toll-as-lockdowns-are-eased https://www.wglt.org/show/wglts-sound-ideas/2020-08-26/isu-professor-herd-immunity-wont-happen-on-its-own https://will.illinois.edu/21stshow/story/math-show-the-pandemic-is-far-from-over https://pantagraph.com/news/local/education/watch-now-illinois-state-university-researchers-team-recommends-n95-masks-for-air-travel/article_99b5420c-2ef8-55d2-978e-f1b6ce02c5f4.html https://pantagraph.com/news/local/education/273-illinois-state-university-cases-have-been-confirmed-since-classes-started/article_84616cae-839b-5e4a-bb61-10bf1792a747.html https://www.wglt.org/local-news/2022-01-13/an-illinois-state-university-professor-with-a-history-of-successful-covid-predictions-reflects-on-a-new-study-that-takes-into-account-human-behavior https://www.myjournalcourier.com/news/article/Illinois-man-created-coronavirus-forecast-models-15323812.php https://pantagraph.com/news/local/watch-now-illinois-state-university-biomathematics-professor-discusses-covid-19/video_bb8d84c8-3ad4-5f40-8927-d6eae21d970b.html https://pantagraph.com/news/local/watch-now-methodology-behind-isu-n95-mask-research/video_83eda0ce-7e34-5052-ad45-517a24b510a7.html
![]()
March 14, 2024
Introducing Olcay Akman, a dedicated educator with over 25 years of partnering...
Read More
Highlights & Overview: MAT2501 showed a 20% increase in the number of students that passed the course YoY, MAT1100 exhibited a 21% increase YoY, and MAT1000 maintained a consistent 83% pass rate. Students who passed MAT1100 and MAT2501 spent an average of 2,097 minutes in Learn, Practice, and Certify – an average of 210 minutes per week, or 30 minutes per day, across the 10-week semester. Students who passed MAT1000 spent an average of 962 minutes in Learn, Practice, and Certify – an average of 192 minutes per week, or 27 minutes per day, across the 5-week course. This study analyzes South College professor Chris Garner’s experience using Hawkes Learning’s course materials. It specifically examines Professor Garner’s course data across three courses– Mathematical Concepts and Applications (MAT1000), College Algebra (MAT1100), and Statistics (MAT2501)–emphasizing pass/fail and the relationship between these grades and students’ time invested in Hawkes Learning’s student software. Background South College initiated a pilot program for courseware in Spring 2021, with Hawkes Learning’s Beginning Statistics. This successful pilot, marked by steady growth and consistent passing rates in Beginning Statistics courses, led to the adoption of three Hawkes titles across the math department at South College in Fall 2021: Beginning Statistics, Introductory & Intermediate Algebra, and Preparation for College Mathematics. In the context of this study, students earning letter grades of A, B, or C are considered to have passed, whereas those receiving a grade of D or F are classified as failed. A, B, C Rate Comparison Statistics (MAT2501) Hawkes Product Used: 3rd Edition Beginning Statistics As illustrated in the chart above, Garner’s MAT2501 section exhibited a remarkable 20% rise in the number of students passing year over year (YoY) (21-22 vs 22-23 academic years) following the adoption of Hawkes. This increase not only reflects a continuous upward trend in the number of passing students but also demonstrates consistent growth among his students. College Algebra (MAT1100) Hawkes Product Used: Introductory & Intermediate Algebra Likewise, we observed consistent success and growth in the total number of students passing Garner’s MAT1100 course with the integration of Hawkes courseware. From the academic year 21-22 to 22-23, there was a 21% increase in the number of students passing YoY. Mathematical Concepts and Applications (MAT1000) Hawkes Product Used: 2nd Edition, Preparation for College Mathematics This course’s analysis involves a considerably smaller enrollment size compared to Garner’s higher-level courses, featuring only 87 and 40 students in each respective academic year. Evaluating this data from a holistic perspective from adoption through the Fall 2023 term indicates a consistent 83% pass rate among all students in this developmental-level course. Investigating Time Spent When investigating trends in student performance as it relates to *time spent in the courseware, the data reveals a direct relationship between the time spent in the Learn and Practice modes and pass rates. Notably, students who received failing grades (D or F) generally invested significantly less time in the software compared to their successful counterparts, underscoring the proven pedagogical design of our 3-step approach to mastery; when ample time is dedicated to genuine engagement and practice with the course material, students generally exhibit increased understanding and retention of course content, and subsequently, higher final grades, as demonstrated in the chart below. South College’s partnership with Hawkes Learning has resulted in sustained success and improved passing rates. The strategic adoption of Beginning Statistics, Introductory and Intermediate Algebra, and Preparation for College Mathematics, coupled with an emphasis on students spending more time in Learn and Practice, has proven to be a successful formula for student success as determined by their final grades. This study suggests that Hawkes’ mastery-based courseware, focusing on student engagement and time investment, can yield significant improvements in academic outcomes. *“Time spent” is measured by the duration a particular page in Learn or Practice remains on the screen, which may not precisely reflect the actual time spent interacting with the content. This variable is presumed to account for outliers in the chart, where some students exhibit high recorded ‘time spent’ without achieving the expected rate of success.
![]()
January 2, 2024
Highlights & Overview: MAT2501 showed a 20% increase in the number of students...
Read More
Discover the inspiring journey of Robert Hunt, a seasoned professor at the University of Mississippi, as we spotlight educators who are truly impacting their students’ lives at Hawkes Learning. Join us for an insightful interview where Robert reflects on his teaching experiences, navigates through challenges, and unveils the transformative role of technology in reshaping the modern classroom. *Interview responses have been lightly edited for content and clarity. How long have you been teaching, and how long have you been teaching with Hawkes? I started teaching as a grad student in the fall of 2002, and did that for a year. I was an adjunct professor in 2003, then full-time in 2004, and I’ve been here at Ole Miss ever since. I’m from Louisiana originally, but I came here and I really liked the lifestyle. Luckily, three positions became open after my adjunct year, and I managed to get one. As far as Hawkes goes, we were just using Statistics way back then. That was when you had the physical codes on the computer and it was offline! Eventually, we migrated to Hawkes with other classes, so I’ve probably been using it for 18 years. What is your favorite thing about the University of Mississippi? It’s a big school, but it still feels small. We have a smaller campus compared to some of the other southeastern universities, but here it’s compact. Even though you’ve got so many students, you’re close to everything. I don’t have to jump on a bus if I want to go to the physics building. It’s an easy walk. We’re always getting ranked as one of the most beautiful campuses in the country and there are tons of programs for young kids growing up. It’s been a great place for me! I’ll always be here. Do you have a secret to teaching? Or a most valuable lesson that you’ve learned in your teaching career? What I’ve learned is that different classes and different courses require different teaching styles. For example, when I’m teaching quantitative reasoning or even linear programming, I’m more hands-on. We do stuff in groups, and I walk around the room talking with people; I’m not just lecturing the whole time. Then, if I’m in a Business Calculus class, I find lecturing works well for that. So, it depends on what you’re teaching and the kind of students you have. What other structures and classroom setups have you tried? What have you found does work well and didn’t work out? You did touch on that already, but is there anything else you’d like to share? I’ve had traditional lectures and it’s okay, but most of my classes are what I’d call a hybrid. Normally, the classes meet for 150 minutes a week, but our classes meet for 100 minutes a week and then have another 50-minute component for homework and quizzes. We used to make them come to the lab but we don’t have enough space anymore, so we let them work from home on this section, so, it’s like a hybrid structure, and we get everything we need covered. And the students like it so – works for me! What would you say is the biggest challenge that students are facing today? Well, during COVID when the high schools were online, I don’t think a lot of them were taught very well. Of course, it was hard then, right? But now, we’re having a lot that come in, and they can’t factor. They can’t deal with fractions. There’s always been a little problem with that in the past, but since COVID, it’s a bigger problem! Hopefully, in a year or two, things will be a little bit back to normal, but that’s the biggest thing right now. What would you say is the biggest challenge that teachers are facing today? With inflation and everything – the tuition going up and the price of books going up – we seem to have more students who are having a hard time buying the materials for the course. Obviously, if they can’t buy the materials for the course that affects the teacher, too. We want to help them. At the same time, I can’t buy materials for everybody who can’t afford it. Hawkes is cheaper than basically every other company. Really, the only way we could make it cheaper is to do freeware or something and those are usually not very good. How do you engage and motivate underperforming students? Constant communication – every week. Also, one thing that’s different about my classes versus most is that we do flex mastery in Hawkes. However, I require 100% mastery so I don’t allow strikes. With 100% mastery, it forces them to look at all the questions and at least get it right once. I think that’s part of the reason our test grades are so good. I also use Hawkes’ Reporting tools when reviewing my sections. I really rely on the WebTest Summary Report and the Search by Criteria Report. I appreciate how I can choose certain parameters to quickly search through my sections in the Search by Criteria Report. I can look at assignment groups or specific assignments and see who’s completing it, who’s not, who’s logging in, and who’s not. I also use the certification status report. I check on that a good bit to see who’s doing the work. Can you tell me about a favorite breakthrough moment that you’ve experienced with a student? 10 years ago there was a student in my class who was not a math person, and he would tell you that. This was in my Quantitative Reasoning course which gives students basic overviews of different things in math that could help with everyday life. I saw him in the Walmart parking lot 3 or 4 years ago. He just thanked me so much for that class, because it was practical. I’m not saying we don’t need Algebra and Calculus, but for a lot of people, they just need the practical side of math – something that they will use. You know, the K-12 teachers always complain about students saying, how am I going to use this in real life? When a student comes back and says, “This really helped,” it feels good! I know that you’ve been teaching with Hawkes for a long time, and you’ve seen Hawkes evolve throughout the years. Can you tell me how your outlook toward technology in the classroom has evolved over time? I used to be against technology in the classroom. However, if you think about 15 years ago, there really wasn’t internet like we use it today! I’ve learned how technology can be useful to bring people together. For example, I can have my students use Hawkes or Desmos to graph certain things to visualize what we are learning versus me trying to draw a rough sketch on the board. There’s more interaction and movement. I used to have a hard time when we would do the limit definition of derivatives, trying to demonstrate the overall concept. Now they have these apps where you can show moving those points together and how the tangent line changes. So teaching is a lot more visual now; I’m all for using technology in a classroom. I Zoom every class, and I didn’t do that until COVID, but I liked it. So, even though I’m teaching in person, I’m still using Zoom. I can walk around the classroom now with a little tablet in my hand, and I can talk to students while showing them my tablet. I think technology’s done a lot more good than it’s done harm for teaching and for education. It’s also more helpful with the data review piece. As you can imagine, we were strictly relying on Excel spreadsheets before. Now, we have all these other tools we did not formerly have. We used to have to report to the Accreditation board – that used to all be on scantron machines! It’s a lot easier to go on Hawkes and pull up the item analysis right there. What led you to Hawkes and what keeps you back? Carolyn Warren was the first one to use Hawkes at Ole Miss. She wrote a Statistics book with Hawkes, and it just grew. We’re a Hawkes school, probably more than a lot of schools. When we were reviewing for the course, it was between Hawkes, Pearson, and another company for the Stats classes. We found that students who used Hawkes got much better on the final exam than all the other ones, so we kept using it, and then we started using Algebra and Business Calculus titles. Hawkes’ Customer Support is so far ahead of all these other education companies. It’s not even up for discussion. To me, it’s the support more than more than anything. That’s why I’m going to use Hawkes if it’s my choice. I’ve used a lot of Pearson in the past, too, and I’m not going to disparage them, but I like the setup of Hawkes. If I need something, or if I need your team to create a feature for me, I can ask you! Hawkes will actually think about it, and you do create a lot of them! Even if you don’t do it, at least you consider my suggestions. Nobody else is going to put the time into creating instructor-requested features. Do you have anything else to share about how the Hawkes mastery approach has really made a difference in your courses, and any other areas in the platform that have really helped your students the most? With Hawkes’ mastery, there is an expectation to master a certain percentage of the homework. With other companies, the students are graded with a raw score and they aren’t challenged to attempt the tougher questions of the lesson. With mastery-based learning, the students are forced to be exposed to all the question types in the lesson. My grades are great, so it seems that with this approach, there come higher expectations and more accountability. Students share in their evaluations that going through Hawkes’ Practice mode with step-by-step guidance really helps them. What are some of your interests outside of campus and in teaching? I’m married and have two kids, ages 10 and 12. I really value my family time! I enjoy sports, and I go to all the football games, plus a lot of baseball games. I go to as many basketball games as I can here on campus, too. My family and I really like traveling. We just went to Virginia and North Carolina over the summer. We took the kids to Williamsburg so they could explore some history. I love music and am big into classic rock but I like other genres, like the blues and old country, too. If you had a colleague, either at Ole Miss or at another school, who is considering using Hawkes in their courses, what advice would you share with them? I would sit them down and log in, and I show them everything. My old officemate at the University of Montevallo in Alabama has been using Hawkes now for about 4 or 5 years. He had a choice between Hawkes and Pearson and at his university. I told him, “Hawkes is going to have everything correct. It’s going to recognize student’s answers during the online answer entry process. Their tech support is great. It’s going be easy for the students to follow along.” Then I logged in, and I showed him the instructor side and the student side. If someone is considering Hawkes, I’ll sit down and show it to them! What would you like your students to take from their learning experience with you? Even if what we’re doing in class is something that you’re not going to be doing every day forever, there is a place for it. It is useful. It is needed. I tell my business students, “You might not ever take a derivative again, but you’re going to have to go talk to an analyst one day and you need to know what they’re talking about.” I always want them to realize that everything we do in math has a purpose, even if they don’t necessarily see that purpose yet. There’s a reason we’re giving it to you. We would like to thank Robert Hunt for sharing insights and experiences with Hawkes Learning. If you’re interested in sharing your own experiences with Hawkes Learning or if you have any questions, please don’t hesitate to reach out to us. We’d love to hear from you!
![Robert Hunt]()
December 6, 2023
Discover the inspiring journey of Robert Hunt, a seasoned professor at the...
Read More
At Hawkes Learning, we love shining a spotlight on dedicated educators who are making a difference in their students’ lives. We’re excited to introduce you to Melinda Clardy, an experienced math instructor at South Louisiana Community College (SLCC) who has been using Hawkes since 2016. In this interview, Melinda shares her teaching experiences, challenges, and insights into how technology has transformed her classroom. *Interview responses have been lightly edited for content and clarity. To get started, which courses do you teach with Hawkes? I have been teaching Math 83 (Remedial Math), our co-requisite model with College Algebra, College Algebra as a standalone course, Trigonometry, and Statistics, all using Hawkes. We also use Hawkes as a course shell for our online Trigonometry and Statistics courses–it’s great to use just one software across these courses and it’s much easier for the bookstore, our students, and myself. I’m a big fan of the Hawkes experience! Could you tell me how long you’ve been teaching and if you have a secret to teaching? I’ve been teaching at SLCC for about seven years now, but in a way, I’ve been teaching my whole life. I was part of a really big class in a really small school, and whenever I finished my work my teachers always said, “go help someone else,” and I did! I think the secret to teaching is to stay in practice. I often tell my students, there’s really no reason that I’m better at math, except that I practice it all the time. What is the most valuable lesson you’ve learned as a teacher? The most valuable thing I’ve learned is to be aware of “expectation drift”– the more you do something, the more it becomes second nature. You stop remembering what it was like to struggle with it. The analogy I use often is tying your shoes; as a child, it was the hardest thing and you probably thought about giving up a couple of different times. Now you do it without giving it a second thought. The same thing applies to algebra when you’re the one teaching the content every year, so I try to be mindful of that. Regarding your classroom structure, what setups and styles have you tried and what have you found has worked and maybe has not worked? Most of the classes that we were teaching pre-pandemic were traditional lectures. I was using Hawkes as a supplement to do the homework, to do the tests and keep everything more uniform that way. Other than the traditional lecture, the most important kind of separation from that would have been the co-requisite. So initially, any teacher could teach the co-requisite. It’s not necessarily the teacher doing the 1105, and we found that didn’t really work. We tried to use it as a separate OER thing, which is fine. However, adding the layer with Hawkes here has really made that a little bit more cohesive. They get a chance to actually see the items in sequence. This is the prerequisite skill and here’s what we’re doing, side-by-side, all presented in the same way, because how you ask a question can make a big difference in how people answer it. The more consistent that we could be, the better off it was. What would you say is the biggest challenge that students are facing today? For our students, everyone has their own life behind the scenes. Finding that balance between their personal life and struggles in school is different for everybody. I think there’s this supposition that you’re the only one having trouble. You think everyone else has it figured out because we all fake it ’til we make it. It’s easy to think, I must be the only one who doesn’t get it. That lack of faith in their own ability, or overestimation of their peers, or the combination of the two is probably what is the hardest thing for a student to get past and learn how to communicate that effectively. What would you say is the greatest challenge that teachers are facing today? Being interesting in a TikTok society is really hard to keep up with. Because most expect instant gratification, the attention span that some people have these days can make people unaware of their expectation drift as well. How engaging should something be before it’s actually important to you, if that makes sense? There’s also that feeling that any information you want is immediately available. So why should I bother to remember something? In a classroom setting that obviously doesn’t work well because exams really do test that underlying comprehension and memorization. It can be a real struggle to try to get everybody on the same page with that. Between that and academic integrity, I think those are the biggest things facing teachers right now. With academic integrity, what are you referring to? Academic integrity is a big concern in the digital age where students have access to various resources. It’s essential to ensure that students are genuinely learning and not taking shortcuts. I want to circle back to when you’re talking about trying to remain interesting with TikTok culture, what are some ways that you’re trying to combat that personally? And what are some methods that you’re employing in the classroom to be relevant? One of the things that I try to do is also something I’ve talked about on your blog before. It’s the idea of being willing to be a little bit silly if it makes an idea stick. One of my most memorable student moments is of my trig teacher in college. She was such a huge inspiration to me going forward. At that moment, she was just some weird little hippie lady, and she was trying to explain the unit circle. It was a little bit incomprehensible to me at the time because we didn’t do trig with the circles as much in high school, but I digress. It was the unit circle she was trying to explain, and she was just up there doing a free-flowing movement with her skirt. And she’s said to imagine that the unit circle is like a spool of thread. I don’t know why, but that one little thing made so much sense. That’s what I try to do. Do you have any other tips or strategies for instructors to maintain student engagement in the classroom? The other thing is embracing and understanding that you can’t please everyone. You do the best that you can, and you hope that it gets through to as many students as possible. Really embrace the idea that you’re not going to get everybody on the same page, and that’s okay. How has Hawkes helped you in your classroom, especially with online learning? It’s given me a lot of tools to be able to identify the things that I need to do. More than anything, it’s given me more freedom to do some of those higher-order thinking things and be aware of the things that they’re really getting hung up on, and what I need to focus on. It’s been a lot more than just giving them a homework tool. Do you have any memorable success stories with students who have used Hawkes in your courses? One student who stands out was actually my favorite high school student because she was a female in a math class, which was relatively rare. She went on to work in a math-related field, and I was really proud of her for it. She just used the extra practice, and she knew that she needed to. She was like, “well, I didn’t get it the first time, so I did it again.” And that’s just it – you’re not just going to get something because you looked at it once. I think that’s something that a lot of people come to college expecting, but that’s really not the case. That’s what we’re here for. Finally, what advice would you give to instructors who are new to using Hawkes Learning or similar technology in their classrooms? One of the things I think is the most valuable is to really have a reason for what you’re doing. I think in a lot of situations, I don’t use the software the way that it’s intended to be used and I’m okay with that because it’s about making my class work for my students. There’s not really a “right” or “wrong” way to use any learning tools; it’s about what’s best for your students. Having a reason for what you’re doing and knowing what you want to get out of it, and not just doing it for the sake of doing it is important. We would like to thank Melinda Clardy for sharing her insights and experiences with us. Her dedication to teaching and innovative approach to using technology in the classroom are inspiring examples for educators everywhere. If you’re interested in sharing your own experiences with Hawkes Learning or if you have any questions, please don’t hesitate to reach out to us. We’d love to hear from you!
![]()
December 5, 2023
At Hawkes Learning, we love shining a spotlight on dedicated educators who are...
Read More
Over the years, Professor Saboori has employed a variety of textbooks in his statistics course. While these Open Educational Resources (OERs) like OpenStax and Introductory Statistics by Shafer and Zhang contained valuable content, he discovered that they were lacking in providing a genuinely active learning experience. This constraint hindered students’ capacity to independently explore concepts and apply them practically, consequently impeding their overall success in the course. Hawkes Learning’s Discovering Business Statistics textbook and mastery-based software effectively fulfilled this need, presenting a multitude of advantages that vastly outweighed the cost savings benefits of OERs. Interactive Learning Environment: Students are equipped with a dynamic, interactive platform where they can actively engage with the material, complete practice problems, simulations, and real-world applications, and develop a deeper understanding of statistical concepts. Self-Paced Learning: One key advantage is the ability for students to progress through the software’s Learn and Practice modes at their own pace, personalizing instruction and allowing each student to grasp the material fully before moving on to Certify and the next lesson. Immediate Feedback and Support: Hawkes Learning offers instant, error-specific feedback on assignments, empowering students to identify and correct mistakes in real-time. Additionally, the platform provides access to an array of resources such as instructional videos and step-by-step problem-solving tutorials to guide students. Engaging and Relevant Content: Discovering Business Statistics incorporates an “outstanding data set that applies real-world data as part of the student learning process,” making the subject matter both relatable and engaging. By bridging the gap between theory and practice, Hawkes fosters a deeper appreciation for the practical applications of business statistics across a span of disciplines and careers. “The textbook is well written, accurate, and reflects the most recent concepts and techniques in teaching statistics.” The interactive nature of the platform, combined with immediate feedback and support, sets the stage for enhanced comprehension and a heightened ability to apply statistical techniques in real-world scenarios. Students become more confident and enthusiastic about their coursework, resulting in higher levels of engagement and participation. By choosing Hawkes Learning over free resources like OpenStax, Professor Saboori has effectively transformed the educational experience for his students at Albright College, preparing them for success in their future courses by empowering students to become proficient problem solvers.
![]()
July 7, 2023
Over the years, Professor Saboori has employed a variety of textbooks in his...
Read More
Teaching a course for the very first time is a nerve-wracking experience for any instructor. The anticipation of how the semester will unfold and the responsibility of imparting knowledge effectively create a sense of uncertainty. However, with the right resources, instructors of all experience levels can help their students succeed. A great example of this success is Professor Brenda Long, who recently taught Math 119, Elementary Statistics at San Diego City College for the first time. Even though she was a bit nervous, Professor Long conquered the spring term prepared with Hawkes Learning’s Beginning Statistics eBook + student software and helpful resources like the provided PowerPoint slides and engaging lesson-level videos. With all these tools at her disposal, she was able to provide her students with an amazing learning experience. “I was a bit nervous at the beginning of the semester as I had not taught this class before,” Long shared. “However, with all the resources that were available to me, I was successful.” Hawkes Learning offers an engaging and mastery-based Learn, Practice, and Certify learning path for homework assignments. Long utilized this interactive resource to help her students learn and apply statistical techniques at their own pace with error-specific feedback to help solidify knowledge. Professor Long’s proactive integration of technology into the classroom created a vibrant learning atmosphere and encouraged students to actively participate in shaping their education. “One of the reasons I was so successful this semester was that I was able to take my students into a computer lab,” the instructor revealed. “With the Learn and Practice mode, I was able to assist them during a lab hour.” This hands-on approach to teaching statistics proved to be immensely beneficial, particularly for students who struggled to grasp the concepts independently. By providing personalized guidance during the lab sessions, Long addressed individual difficulties and improved students’ understanding of statistical principles. The outcome of the course surpassed Long’s expectations with every student who completed the course successfully passing the class! Undoubtedly, Long’s commitment to utilizing available resources and providing exceptional support to students has played a vital role in this achievement. Hawkes Learning takes great pride in collaborating with devoted educators like Professor Long, as they enhance the student experience and empower learners to reach, and exceed their goals.
![]()
June 15, 2023
Teaching a course for the very first time is a nerve-wracking experience for...
Read More
Courses: Elementary Statistical Methods MATH 1342 Course Type: Corequisite Lecture Quick Stats: 62% decrease in withdrawals 33% of students finished with an A 175% increase in passing rates After seeing increased student success in her curriculum-level statistics course at Dallas College, Professor Yolanda Manzano implemented Hawkes Learning’s Beginning Statistics courseware in her corequisite lecture course as well. Students that are deemed unprepared for curriculum-level statistics are placed in a corequisite course where they receive additional instruction on prerequisite skills outside of the traditional curriculum-level course with their peers. Because these classes are corequisites, they meet for three hours twice a week. By the end of fall 2021, 66% of students finished with a C or above compared to the 24% of students receiving a C or above using Carnegie Math Pathways (WestEd) in the fall of 2019. 43% more students passed the course using Hawkes compared to those using the competitor product. The fall 2021 class also saw a significant 62% decrease in the number of students who decided to withdraw from this course. When asked about students’ success using Hawkes, Professor Manzano highlighted the mastery learning pedagogy of the software, which encourages students to continue working through the material and “not settle for a low score”. She finds the software to be user-friendly and also noted the responsive and friendly tech support team that she and her students have experienced while working with Hawkes Learning. “…I like to use Chapter Projects as classroom activities… I love these because they reinforce concepts in a way that extends their knowledge by applying it in different scenarios. Making this connection is important to me because it helps them to retain information and use statistical concepts in their daily lives.” –Professor Yolanda Manzano
![]()
April 20, 2022
Courses: Elementary Statistical Methods MATH 1342 Course Type: Corequisite...
Read More
Rguroo is a point-and-click statistical software that unleashes the power of R on the Cloud, making this powerful software available to instructors and students across the country. This user-friendly software includes features such as: Data cleaning & manipulation tools Easy to use tools for creating & customizing plots Interactive data visualization Data modeling & statistical inference Simulation suits & probability calculators We chatted with one of Rguroo’s creators, Dr. Mori Jamshidian. Here’s what he had to say about his experience and this powerful yet easy-to-use software. The following interview has been lightly edited for content and clarity. Can you provide a little info about your teaching background? I started teaching when I was a graduate student in the Math Department at UCLA in the mid- to late 1980s. After getting my Ph.D., I got a position as a senior statistician at BMDP statistical software. While at BMDP, however, I also taught statistics courses at UCLA as an adjunct professor. It was at the University of Central Florida Statistics Department (1996-2002) that I started my full-time teaching position. There, I began as an assistant professor, and in 2005 I got my tenure and was promoted to Associate Professor. From 2002 to the present, I have had a position at CSU Fullerton (CSUF). I am tenured and have the rank of Professor at CSUF. Throughout my teaching career, I have taught a variety of statistics courses ranging from introductory to upper-division and graduate-level courses, including both applied and theoretical subjects. My recent classes at the undergraduate level include Introductory Statistics and an Intermediate Data Analysis. At the graduate level, I have been teaching Probability Theory and Statistical Inference, Computational Statistics, and Statistical Consulting. I have also had an interest and have taught courses in numerical analysis. What led you to create Rguroo? In 2010, I was appointed as the coordinator for our introductory statistics course at CSUF. When I started in this role, instructors were teaching their classes without using any software. I firmly believed and continue to believe that the use of statistical software is a must in teaching statistical concepts. So, my initial thought was to use R/Rstudio in the course. This thought led to the writing of a manuscript that showed how the R/Rstudio language could be used to make graphs and perform introductory-level statistical analyses. I wrote this manuscript with Mojgan Khatoonabadi (a colleague) and Cengage published it. It turned out that this manuscript was not much of a help, as our instructors spent much of their time in correcting the required codes for students (e.g.: students did not pay attention to capitalization, or they would forget to close parentheses, etc.). So, the use of R/Rstudio failed. Amidst this failure, and about six years ago, Shahram Zadeh, a good friend, and I were attending our mutual friend’s birthday party. There, Shahram approached me and asked if I thought that there was a project that we could do together. Knowing that Shahram was a veteran software engineer, I brought up the idea of creating a point-and-click interface on top of R. He added to this idea the possibility of creating a web application. These ideas led to the start of what we called “a fun project.” The next day, I wrote an R code to create a histogram, and Shahram took that code and did his software engineering thing, and the histogram that was created in R showed up in a browser. This turned out to be the inception of what we know today as Rguroo. Since then, the Rguroo team, Shahram, and I have been working tirelessly to develop Rguroo and make it better and better for teaching. We also hope that as we make progress in our development of Rguroo, it finds its way to the industry as well. Can you provide an example or two of how you’ve used Rguroo in your class? I have used Rguroo in both my introductory statistics classes and my intermediate-level data analysis classes. In both levels, I have used Rguroo for exploratory data analyses using graphs and summary statistics, as well as conducting statistical inference and building regression models. More notably, I have used Rguroo to teach statistical concepts using the powerful yet easy to use Rguroo simulation tools. While the use of Rguroo does not require knowledge of the R language, users who know R can take advantage of this knowledge to conduct sophisticated analyses. For example, the R language can be used in Rguroo’s simulation functions or other functions such as the Transformation function. I have used this capability to teach my intermediate-level students some basics of the R language. For example, my students can write an R code within the Rguroo simulation tool to perform regression analysis using bootstrap. What’s your favorite part of Rguroo? Do you have a favorite lesson plan to share? I have lots of favorites, but to name one, I must say Rguroo’s reproducibility. By this, I mean that when we are doing a project, we can save it at any stage, logout, and come back to continue where we left off. Or, we can export our projects as what are called “RGR files” and share them with other Rguroo users. This reproducibility comes in handy in my teaching in various ways. As students work in the lab and the lab hour ends, they can save their unfinished work and go home to finish their projects. As I teach in the classroom using Rguroo, I save what I input in Rguroo, and I export the work as RGR files to share with students for their review and as a supplement to their notes. Students can import RGR files into their Rguroo account and see what we did in class. Students also submit RGR files as part of their project, so when my grader or I grade their projects, we have access to how they generated a graph or conducted their analyses. As for my favorite lesson plans, I have many. Dwight Wynne, a colleague at CSUF, and I have several lesson plans involving Rguroo that we use in our introductory and intermediate level courses, and we would be happy to share them. How have your classes changed since implementing Rguroo? Have you noticed your students learn a particular concept more quickly or engage with topics more fully? As I noted earlier, after the unsuccessful use of R in our introductory statistics courses, Rguroo has been a welcome change—a change that has made our courses more useful and fun for our students, as well as making my teaching easier. This is mainly attributed to the fact that we can use Rguroo to easily and quickly draw graphs, or compute a probability using a probability calculator, or do other computations. I spend the time that I save explaining statistical concepts better, interacting with students more, and doing more examples. Another change that Rguroo has brought to my teaching: I use fewer PowerPoint notes. My teaching, for the most part, has become dynamic as we explore a dataset or conduct a test of hypothesis or build a regression model step by step with students. This mode of teaching allows students to follow and contribute ideas to each step taken in discovery and problem solving, hopefully leading to better understanding of what is being taught. What, in your opinion, are the top differentiators between Rguroo and other statistics software packages on the market? Its reproducibility, the fact that it’s designed by instructors for instructors, the rich data repository, and the ability to export reports to Word.
![]()
April 30, 2020
Rguroo is a point-and-click statistical software that unleashes the power of R...
Read More
The Viewing Life Mathematically software has 57 new questions available in Chapter 8: Statistics. With multiple iterations for each, these algorithmically generated questions provide 2,765 options for practice and assessment. 8.1: Collecting Data 8.2: Displaying Data 8.3: Describing and Analyzing Data Examples range in level of difficulty and mimic real-world data. Several allow students to create their own graphs, and many involve frequency tables, histograms, pie charts, and line graphs. Consider an example from Lesson 8.2: 21-B Book Street Books sells about 5,400 books each month. The pie chart displays the most popular book categories, by percentage, each month. Find the number of romance books sold each month. Round your answer to the nearest integer. View examples of new questions. How to add these new questions to your assignments: These questions will automatically be added to assignments if you are using the Hawkes Default Curriculum. If you have a customized curriculum, add these new questions to Certify assignments in Curriculum or your online WebTests. To add these questions to a custom Curriculum: In the Grade Book, select Assignments Tab > Curriculum. Name the curriculum template and select Save Changes. Select any Lesson Name in the right column. New questions will display in the left column without the ‘In Use’ designation. Select the Add button to include questions. To add these questions to a current WebTest: In the Grade Book, select Assignments Tab > WebTest. Select the Manage tab, then select the test name and Copy button. Select the Edit icon to the left of the copy of the Test. Select a Chapter then Lesson from the left column. New questions will display in the left column without the ‘In Use’ designation. Select the Add button to include questions. If you have questions, contact your Training & Support Specialist at 1-800-426-9538 or training@hawkeslearning.com.
![]()
January 24, 2020
The Viewing Life Mathematically software has 57 new questions available in...
Read More
The NEW title, Pathways to College Mathematics, is designed to prepare students for any mathematics pathway curriculum course. It offers a general survey of mathematics and a flexible, accelerated path to future studies in Liberal Arts Math, Quantitative Reasoning, Introductory Statistics, or STEM. It streamlines introductory level algebra content and introduces students to other fields of math, including geometry, consumer mathematics, logic, probability, and statistics. Table of Contents Chapter 0: Strategies for Academic Success 0.1 How to Read a Math Textbook 0.2 Tips for Success in a Math Course 0.3 Tips for Improving Math Test Scores 0.4 Practice, Patience, and Persistence! 0.5 Note Taking 0.6 Do I Need a Math Tutor? 0.7 Tips for Improving Your Memory 0.8 Overcoming Anxiety 0.9 Online Resources 0.10 Preparing for a Final Math Exam 0.11 Managing Your Time Effectively Chapter R: Review of Foundational Math Skills R.1 Exponents, Prime Numbers, and LCM R.2 Fractions (Multiplication and Division) R.3 Fractions (Addition and Subtraction) R.4 Decimal Numbers R.5 Bar Graphs, Pictographs, Circle Graphs, and Line Graphs Chapter Review Chapter 1: Algebraic Pathways: Real Numbers and Algebraic Expressions 1.1 The Real Number Line and Absolute Value 1.2 Operations with Real Numbers 1.3 Problem Solving with Real Numbers 1.4 Square Roots and Order of Operations with Real Numbers 1.5 Properties of Real Numbers 1.6 Simplifying and Evaluating Algebraic Expressions 1.7 Translating English Phrases and Algebraic Expressions Chapter Review Chapter 2: Algebraic Pathways: Linear Equations and Inequalities 2.1 Solving One-Step Linear Equations 2.2 Solving Multi-Step Linear Equations 2.3 Working with Formulas 2.4 Applications of Linear Equations 2.5 Ratios, Rates, and Proportions 2.6 Modeling using Variation 2.7 Solving Linear Inequalities in One Variable Chapter Review Chapter 3: Algebraic Pathways: Graphing Linear Equations and Inequalities 3.1 The Cartesian Coordinate System, Scatter Plots, and Linear Equations 3.2 Slope-Intercept Form 3.3 Point-Slope Form 3.4 Introduction to Functions and Function Notation 3.5 Linear Correlation and Regression 3.6 Systems of Linear Equations in Two Variables 3.7 Graphing Linear Inequalities in Two Variables Chapter Review Chapter 4: Algebraic Pathways: Exponents and Polynomials 4.1 Exponents 4.2 Scientific Notation 4.3 Modeling with Exponential Functions 4.4 Addition and Subtraction with Polynomials 4.5 Multiplication with Polynomials Chapter Review Chapter 5: Algebraic Pathways: Factoring and Solving Quadratic Equations 5.1 GCF and an Introduction to Factoring Polynomials 5.2 Factoring Trinomials 5.3 Special Factoring Techniques and General Guidelines for Factoring 5.4 Solving Quadratic Equations by Factoring 5.5 Operations with Radicals 5.6 Solving Quadratic Equations by the Square Root Property and the Quadratic Formula 5.7 Applications of Quadratic Equations 5.8 Graphing Quadratic Functions Chapter Review Chapter 6: Geometric Pathways: Measurement & Geometry 6.1 US Measurements 6.2 The Metric System: Length and Area 6.3 The Metric System: Capacity and Weight 6.4 US and Metric Equivalents 6.5 Angles 6.6 Triangles 6.7 Perimeter and Area 6.8 Volume and Surface Area 6.9 Right Triangle Trigonometry Chapter Review Chapter 7: Pathways to Personal Finance 7.1 Percents 7.2 Simple and Compound Interest 7.3 Buying a Car 7.4 Buying and Owning a House Chapter Review Chapter 8: Pathways to Critical Thinking: Sets and Logic 8.1 Introduction to Sets 8.2 Venn Diagrams and Operations with Sets 8.3 Inductive and Deductive Reasoning 8.4 Logic Statements, Negations, and Quantified Statements 8.5 Compound Statements and Connectives 8.6 Truth Tables Chapter Review Chapter 9: Statistical Pathways: Introduction to Probability 9.1 Introduction to Probability 9.2 The Addition Rules of Probability and Odds 9.3 The Multiplication Rules of Probability and Conditional Probability 9.4 The Fundamental Counting Principle and Permutations 9.5 Combinations 9.6 Using Counting Methods to Find Probability Chapter Review Chapter 10: Statistical Pathways: Introduction to Statistics 10.1 Collecting Data 10.2 Organizing and Displaying Data 10.3 Measures of Center 10.4 Measures of Dispersion and Percentiles 10.5 The Normal Distribution Chapter Review Chapter A: Appendix A.1 Matrices and Basic Matrix Operations Are you an instructor who’s interested in seeing more? Contact us at 1-800-426-9538 or info@hawkeslearning.com to receive FREE student software access.
![]()
September 23, 2019
The NEW title, Pathways to College Mathematics, is designed to prepare students...
Read More
Do your statistics students ever get lost in the theory of the material or have trouble grasping concepts covered in class? Hawkes Learning’s free online resource, stat.hawkeslearning.com, features 3 main tools designed to bring clarity to these students: 1. Chapter Projects New projects from Discovering Statistics and Data can be assigned as homework or in-class group projects to encourage discussion and active learning. Example chapter projects include using linear regression to analyze and predict home prices, calculating the probability of getting specific cards from a standard deck, and analyzing the Moneyball data set providing selected statistics for Major League Baseball teams. 2. Data Sets There’s a story behind every data set. Help your students take real-world data and make meaning from it. Our curated list of data sets accompanying the new Discovering Statistics and Data textbook allows students to apply skills learned in class to tangible examples. Each data set can be easily downloaded to use as a complement to chapter projects and in-class exercises. Download a giant data set, U.S. County Data, today! Variables include: Ethnicity & age breakdown Poverty & household income levels Temperature & precipitation rates Crime rates Education & degree attainment Obesity, diabetes, & other health data 3. Technology Instructions For students to fully grasp concepts, they need to try their hand at the applications. Unfortunately, that’s hard to do if students don’t know how to use the necessary technology. That’s why we offer free tech instructions that walk students through each step and input along the way. Search by chapter or topic to find step-by-step instructions available for students stuck on the process of a problem. Check out the website for yourself at stat.hawkeslearning.com! Interested in seeing more of this course? Contact us today at info@hawkeslearning.com or 1-800-426-9538 to get free access to the student courseware!
![]()
June 5, 2019
Do your statistics students ever get lost in the theory of the material or have...
Read More
Students in your corequisite course have most likely seen these lessons before—some even two or three times. Yet, it’s just not sticking, and students are feeling frustrated. What can you do? Contextualize the prerequisite content for your corequisite students. Updates to the Beginning Statistics + Integrated Review courseware include new Making Connections and Looking Ahead sections in review lesson modules. These sections provide examples and videos connecting the foundational concepts to the credit-bearing material. The Making Connections section informs students at the beginning of the lesson why they need to learn the upcoming review content. Check out the example from the “The Real Number Line and Inequalities” lesson: Students then walk through the instructional content of the lesson to get familiar with the concepts. At the end, they encounter the new Looking Ahead section, which shows students how to apply what they’ve learned and how it will help them understand the next lesson: Explore another example from our “Area” lesson. Before students delve into the material, they get a brief introduction: Once students are acquainted with the lesson, they can look ahead to what’s next: With this contextualized approach to learning, students will gain a greater sense of why they’re being taught this information, making it more important to them. Interested in seeing more of this course? Contact us today at info@hawkeslearning.com or 1-800-426-9538 to get free access to the student courseware!
![]()
January 28, 2019
Students in your corequisite course have most likely seen these lessons...
Read More
Students in your corequisite course have most likely seen these lessons before—some even two or three times. Yet, it’s just not sticking, and students are feeling frustrated. What can you do? Contextualize the prerequisite content for your corequisite students. Updates to the Discovering Statistics and Data + Integrated Review courseware include new Making Connections and Looking Ahead sections in review lesson modules. These sections provide examples and videos connecting the foundational concepts to the credit-bearing material. The Making Connections section informs students at the beginning of the lesson why they need to learn the upcoming review content. Check out the example from the “Addition with Real Numbers” lesson: Students then walk through the instructional content of the lesson to get familiar with the concepts. At the end, they encounter the new Looking Ahead section, which shows students how to apply what they’ve learned and how it will help them understand the next lesson: Explore another example from our “Absolute Value Inequalities” lesson. Before students delve into the material, they get a brief introduction: Once students are acquainted with the lesson, they can look ahead to what’s next: With this contextualized approach to learning, students will gain a greater sense of why they’re being taught this information, making it more important to them. Interested in seeing more of this course? Contact us today at info@hawkeslearning.com or 1-800-426-9538 to get free access to the student courseware!
![]()
January 28, 2019
Students in your corequisite course have most likely seen these lessons...
Read More
The new Discovering Statistics and Data text offers 36 (and counting!) real data sets for free download. The companion website to the new Discovering Statistics and Data textbook, stat.hawkeslearning.com , supplies updated and relevant data sets, instructions on computational technologies, and access to data visualization tools and websites. These large data sets expose students to the kind of real-world data they will encounter in their future careers. With so many variables and data points included, students must learn to work the data and make meaning from all the information provided. This free online resource from trusted sources shows how interesting exploring data can be. Students will learn to work with raw data and draw meaningful conclusions. Exercises in the new Discovering Statistics and Data textbook refer to the data sets provided on this curated website. Teaching a corequisite statistics course? The new Discovering Statistics and Data + Integrated Review emphasizes the importance of data in today’s world and is designed to provide all developmental math content needed to support statistics learners. Request a free exam copy here.
![]()
November 5, 2018
The new Discovering Statistics and Data text offers 36 (and counting!) real...
Read More
Creating a universally engaging classroom environment can be challenging, but having the right tools that make lesson content relevant to students helps! Below are 5 ways to get your students more excited about statistics: 1. Interesting Data Finding data on topics students think are fun, like beers and breweries across the country, might pique interest. Use this spreadsheet from the U.S. Census to show them socioeconomic trends they may witness themselves in their own demographic (or age bracket). 2. Visualization Tools Seeing is believing. The free online resource Gapminder offers a graphical simulator depicting 5 dimensions of real-world data in 2D. Students can change the relationships between demographic, economic, and societal variables animated over time to see some pretty neat relationships in motion. 3. Applications Challenge Knowing the immediate value of the lesson they’re learning gives students more encouragement to commit the content to memory. Asking students to find their own data sets on their favorite sports team or something they connect with might engage their interest and help them truly grasp the concepts. 4. Games You know statistics can (and is!) fun, and who doesn’t like to win? Interacting with a game and trying to win it make learning more exciting. View some examples of statistics games here. 5. Simulations Help students grasp key concepts through simulations that hold their attention! Use simulations in class and encourage students to work through as a group to liven up the lecture time. Check out fun simulations here. EXPLORE MORE ENGAGING APPLICATIONS OF STATISTICS
![]()
September 18, 2018
Creating a universally engaging classroom environment can be challenging, but...
Read More
Statistics instructors, have you explored Gapminder yet? It’s one of our favorite data visualization resources! It’s a free site offering many videos and tools, including a graphical simulator depicting 5 dimensions of real-world data in 2D. Check out how you can use this tool in your classroom to show students the changing relationships between demographic, economic, and societal variables animated over time. Change the variables to include life expectancy, average income, population, unemployment rate, CO2 emissions, amount of cell phone users, and more. Pinpoint specific historical events to discover their impact through data visualization. Correlating development data Select Chart and compare different indicators, such as Life Expectancy and Income. What correlations can be found? Analyzing trends Try choosing Life Expectancy and analyzing changes over time (select Time for the x axis.) Track selected countries by selecting them, clicking the Trails box, and playing the animation. Mapping development indicators Select Map and look for patterns by selecting different development indicators for the countries. Along with many downloadable data sets and computational technology instructions, this data visualization tool is available on our free web resource, stat.hawkeslearning.com. This tool is also integrated within our new text, Discovering Statistics and Data, to bring students toward a deeper understanding of statistics and how we can tell stories through data analysis. Let us know if you want an exam copy at 1-800-426-9538 or sales@hawkeslearning.com! FREE TO USE! CC-BY GAPMINDER.ORG. SHOWING A FREE VISUALIZATION FROM GAPMINDER.ORG, CC-BY LICENSE.
![]()
April 24, 2018
Statistics instructors, have you explored Gapminder yet? It’s one of our...
Read More
We’re proud to announce the new edition of Discovering Statistics and Data! This new edition pays homage to modern day’s technology-driven data explosion, helping students understand the context behind future statistical concepts to be learned and explaining why the study of statistics is critical. View a free sample of the new edition of Discovering Statistics and Data. The text opens by describing the necessity of understanding the data around us, introducing students to what data is, how we measure it, where it comes from, how to visualize it, and what kinds of career opportunities surround its analysis and processing. This focus makes upcoming content more meaningful for students and then challenges them to think with statistics. Request an examination copy. NEW features include: Greater focus on data – Introductory chapters place a strong emphasis on helping students understand where data comes from, data visualization techniques, “Big Data,” and the problems arising from having large data sets. Downloadable data sets – More real data sets are available for download, including over 15 large data sets and one giant data set. More technology integration – Detailed instruction using graphing calculators, Excel, Minitab, and R Statistical language are included. Real-world applications – Larger scale chapter projects challenge students and brief, relatable articles engage readers. Expanded exercises and examples – Over 60 examples and 200 exercises, including new conceptual questions, have been added. Pedagogy modernization – GAISE guidelines were carefully considered and incorporated, and the most current P-value significance testing recommendations published by the ASA for guidance on hypothesis testing are included. Virtual simulations and games – Students develop conceptual understanding and statistical literacy through hands-on interactives and simulations. Table of Contents: 1. Statistics and Problem Solving The Meaning of Data Statistics as a Career The Data Explosion Modern Computing, Networks, and Statistics Big Data Introduction to Statistical Thinking Descriptive vs. Inferential Statistics The Consequences of Statistical Illiteracy 2. Data, Reality, and Problem Solving Collecting Data Data Classification Time Series Data vs. Cross-Sectional Data Data Resources 3. Visualizing Data Frequency Distributions Displaying Qualitative Data Graphically Constructing Frequency Distributions for Quantitative Data Histograms and Other Graphical Displays of Quantitative Data Analyzing Graphs 4. Describing and Summarizing Data from One Variable Measures of Location Measures of Dispersion Measures of Relative Position, Box Plots, and Outliers Data Subsetting Analyzing Grouped Data Proportions and Percentages 5. Discovering Relationships Scatterplots and Correlation Fitting a Linear Model Evaluating the Fit of a Linear Model Fitting a Linear Time Trend Scatterplots for More Than Two Variables 6. Probability, Randomness, and Uncertainty Introduction to Probability Addition Rules for Probability Multiplication Rules for Probability Combinations and Permutations Combining Probability and Counting Techniques Bayes’ Theorem 7. Discrete Probability Distributions Types of Random Variables Discrete Random Variables The Discrete Uniform Distribution The Binomial Distribution The Poisson Distribution The Hypergeometric Distribution 8. Continuous Probability Distributions The Uniform Distribution The Normal Distribution The Standard Normal Distribution Applications of the Normal Distribution Assessing Normality Approximations to Other Distributions 9. Samples and Sampling Distributions Random Samples and Sampling Distributions The Distribution of the Sample Mean and the Central Limit Theorem The Distribution of the Sample Proportion Other Forms of Sampling 10. Estimation: Single Samples Point Estimation of the Population Mean Interval Estimation of the Population Mean Estimating the Population Proportion Estimating the Population Standard Deviation or Variance Confidence Intervals Based on Resampling (Bootstrapping) (Courseware only) 11. Hypothesis Testing: Single Samples Introduction to Hypothesis Testing Testing a Hypothesis about a Population Mean The Relationship between Confidence Interval Estimation and Hypothesis Testing Testing a Hypothesis about a Population Proportion Testing a Hypothesis about a Population Standard Deviation or Variance Practical Significance vs. Statistical Significance 12. Inferences about Two Samples Inference about Two Means: Independent Samples Inference about Two Means: Dependent Samples (Paired Difference) Inference about Two Population Proportions Inference about Two Population Standard Deviations or Variances 13. Regression, Inference, and Model Building Assumptions of the Simple Linear Model Inference Concerning β1 Inference Concerning the Model’s Prediction 14. Multiple Regression The Multiple Regression Model The Coefficient of Determination and Adjusted R2 Interpreting the Coefficients of the Multiple Regression Model Inference Concerning the Multiple Regression Model and its Coefficients Inference Concerning the Model’s Prediction Multiple Regression Models with Qualitative Independent Variables 15. Analysis of Variance (ANOVA) One-Way ANOVA Two-Way ANOVA: The Randomized Block Design Two-Way ANOVA: The Factorial Design 16. Looking for Relationships in Qualitative Data The Chi-Square Distribution The Chi-Square Test for Goodness of Fit The Chi-Square Test for Association 17. Nonparametric Tests The Sign Test The Wilcoxon Signed-Rank Test The Wilcoxon Rank-Sum Test The Rank Correlation Test The Runs Test for Randomness The Kruskal-Wallis Test 18. Statistical Process Control (Courseware only) Request an examination copy. Want to know more? Contact us at sales@hawkeslearning.com!
![]()
January 15, 2018
We’re proud to announce the new edition of Discovering Statistics and Data!
Read More
Hawkes statistics courses include games and simulations that help students apply key concepts to the world outside of the classroom. Check these out below! If you’re an instructor who would like to explore these games and simulations yourself, sign up for free student access today. GAMES 1. Games of Chance Relevant Application: This lesson helps students apply the concept of the expected value of a random variable to winning or losing games. Students develop a rational approach to analyzing decisions that involve risk. After all, many business decisions—such as purchasing new equipment, hiring additional employees, and expanding into new markets—involve some kind of risk, and students need to assess these situations as best as they can. Learn Key Concepts: Basic probability distribution Binomial distribution function Hypergeometric distribution function 2. Direct Mail Relevant Application: Even in today’s digital world, direct mail marketing remains one of the most viable and proven strategies to connect with customers. Active Learning Approach: By assuming the role of a direct mail marketing manager, students start off with $20,000. They are then tasked with developing a strategy by finding mailing lists that will produce sufficient sales, using confidence intervals to determine which lists to use to reach their $40,000 goal. They win when they correctly formulate which questions they need to solve, collect the data, and analyze the data to evaluate potential risk and profitability for each mailing list. Learn Key Concepts: The game provides an environment in which students apply statistical concepts while making business decisions. They also learn the following: Confidence intervals Experimentation Statistical analysis Inference 3. Estimating Population Proportions Relevant Application: Students might not realize at first how many decisions involve measurements of a population attribute. For example, television stations base advertising charges on ratings that reflect the percentage of viewers who watch a particular show. Political analysts are concerned with the fraction of voters who prefer a certain candidate. No matter the field, estimating population proportions gives us greater insight into the data given to us. Active Learning Approach: In the game, students see a box filled with red and blue balls, and are asked to estimate the proportion of red balls in the population. They can draw sample sizes of 20, 50, or 100 to help them estimate the population proportion. Learn Key Concepts: Determine the minimum sample size for a particular confidence level. Construct a confidence interval for a population proportion. 4. Central Limit Theorem with Proportions Relevant Application: In many decisions, the variable of interest is a proportion. A university may want to know the fraction of first-year students with low grades in order to provide more support and resources for them. Manufacturers may be concerned with the fraction of parts that are defective. Active Learning Approach: Students see a box of red and blue balls, then draw three samples to calculate the sample proportions for each sample taken. Students draw samples again after being informed that samples of first 20 balls and then 40 balls were drawn 200 times to determine the proportion of the number of red balls to the total number of balls chosen. Students then view the data, including tables and histograms, to understand that the sampling distribution of the sampling proportion is approximately normal. Learn Key Concepts: Determine p-hat using the Central Limit Theorem for population proportions. SIMULATIONS 1. Name That Distribution Relevant Application: This concept builder strengthens analytical skills in distribution recognition and data analysis. By detecting symmetric or skewed data, students will begin to understand how to apply this knowledge in the real world. Active Learning Approach: Students are asked to identify the type of distribution from a given histogram, frequency/relative frequency distribution, statistics table, or set of sample data. They can increase the number of intervals on the histogram or frequency distribution, view different sample displays, or choose to view a hint before submitting their answer. Learn Key Concepts: Analyze the histogram, frequency, statistics, and sample data of a distribution. Identify different distribution types: uniform, normal, exponential, chi-square, Poisson, and mystery. 2. Central Limit Theorem Relevant Application: This simulation shows students how to use samples to make useful predictions about a population. Since many population sizes are too large to have their data collected and analyzed, we turn to the Central Limit Theorem for help. The visual nature of this simulation lets students truly comprehend how the sample means from any population are normally distributed, regardless of the original population’s distribution. Active Learning Approach: Students select a parent distribution and set the sample sizes and the burst rate. They choose the desired distribution type: exponential, chi-square, normal, Poisson, or bi-modal. Students can decide to run the simulation a set number of times or automatically, which will keep the simulation running. Learn Key Concepts: Sample population Mean Variance Standard deviation Distribution type 3. Type II Error Relevant Application: Understanding hypothesis testing and type II error is essential to fields like evidence-based medicine, quality engineering, and reliability engineering, among others. Active Learning Approach: The variance, hypotheses, and critical values are given. Students can increase or decrease the level of significance (α), true mean (μ), and sample size to see how these changes affect the other factors involved. Learn Key Concepts: Examine the interrelationship between α, sample size, and β (the probability of making a type II error). Develop an understanding of the concept of type II errors and the calculation of beta. Explore the relationship between α and β. Are you an instructor who would like to explore these lessons further? Sign up for FREE student access today!
![]()
October 16, 2017
Hawkes statistics courses include games and simulations that help students...
Read More
Remember that in the appendix of your courseware, great resources for student engagement help you bring the real world into your classroom! Check out two examples: 1. Direct Mail Game In the game, students assume the role of a direct mail marketing manager for a company that markets inexpensive computer software. Their task is to develop a mailing strategy by finding mailing lists that will produce sufficient sales to be profitable. The game provides an environment in which students apply statistical concepts while making business decisions. While students can explore the game on their own, we recommend playing it in class. Dr. Hawkes created this game when he was a statistics professor. He says that this lesson was always his students’ favorite each semester. 2. Name That Distribution Name that Distribution is a concept builder that strengthens analytical skills in distribution recognition and data analysis. Students view the histogram, frequency, statistics, and sample data of a distribution. They can increase the number of intervals and choose to view a hint if they’re unsure of the answer. As they play with the different options to analyze the data, students combine that information to make an educated guess about the distribution type. Check out a hint: Below is an example of a distribution type: Students new to this kind of data analysis will begin to understand how they can apply this knowledge to the many real-world scenarios that they can evaluate through detecting typical or skewed data. The Direct Mail lesson is available in: Discovering Statistics Appendix A.9 Discovering Business Statistics Appendix A.10 Beginning Statistics Appendix A.5 The Name that Distribution lesson is available in Appendix A.3 in all three statistics courses.
![]()
March 22, 2017
Remember that in the appendix of your courseware, great resources for student...
Read More
One of our favorite statistics resources is Minitab’s blog, https://blog.minitab.com/. Here, statisticians have compiled tips, tricks, and how-tos regarding anything stat-related, as well as easy ways to use Minitab. These posts are great to share in class or assign for homework so students better understand the concepts they’re applying. Students will like them because most posts are short and to the point, include images of the software so they don’t get lost in each step, and make connections to real-world examples of statistics. One post, How to Compute Probabilities, walks students through using the Minitab software to compute binomial probabilities, create a table of probabilities, and then visualize them. Another post, Five Ways to Make Your Control Charts More Effective, gives audiences a practical, five-step guide to enhancing their control charts, including identifying drifts ASAP and accounting for atypical periods. Michelle Parat’s Statistical Tools for Process Validation series walks readers through process design, process qualification, and continued process verification to show audiences not only how to complete these steps, but to understand how important they are at companies and real-world settings. Hawkes Learning’s statistics materials can be bundled with Minitab. Just call us at 1-800-426-9538 to learn more about this option!
![]()
February 28, 2017
One of our favorite statistics resources is Minitab’s blog,...
Read More
Remember when we told you about some of the simulations in our statistics courseware? Well, simulations are so cool that we needed a blog post about two more! Check out these simulations available in our Beginning Statistics, Discovering Statistics, and Discovering Business Statistics courseware below. These simulations engage students with hands-on applications to make difficult concepts easier to grasp. Type II Error Found in the following courses’ Learn screens: Beginning Statistics A.4 Discovering Business Statistics A.11 Discovering Statistics A.10 This simulation on Type II Errors shows students the interrelationship between alpha, sample size, and population variance. Students can develop an understanding of the concept of Type II errors and the calculation of beta, and they can play around with the simulation in order to explore the relationship between alpha and beta errors. Central Limit Theorem with Proportions Found in the following courses’ Learn screens: Beginning Statistics 7.3 Discovering Business Statistics 8.4 Discovering Statistics 9.8 We know that a sample is a subset of the population. When we need to learn more about a population, we collect data from a sample. After all, the sample proportion is a pretty good estimate of the population proportion. To illustrate how the sample proportion varies depending on the selected sample, we have a simulation that draws three different samples. All you have to do is select the “Draw Sample” button for each box, and the simulation calculates the sample proportions for each sample taken: After this simulation, students learn how to find the probability that a sample proportion will be at least a given value, will be more than a given value, and will differ from the population proportion. Want to see more? Contact us at 1-800-426-9538 or sign up for an online demonstration today.
![]()
June 13, 2016
Remember when we told you about some of the simulations in our statistics...
Read More
Many concepts in statistics can be hard to grasp for students, especially if they get stuck on their homework after class with no one around to guide them. Sometimes they need a little more than just text to really understand the material. Now they can access key simulations in the instructional Learn mode of the Hawkes courseware for that extra help! The Central Limit Theorem Found in our Beginning Statistics Chapter 7.1, Discovering Statistics Chapter 9.1, and Discovering Business Statistics Chapter 8.3, the introduction to the Central Limit Theorem is essential to statistics students. There’s a lot to it, so we break down the setup and distribution in the simulation: Students can choose how many observations to simulate. They can also choose what kind of distribution: Uniform Exponential Chi-square Normal Poisson Bi-modal Students can then run another simulation or select “Auto” for the simulation to continuously run. Estimating Population Proportions Want students to learn more about population proportions? We’ve got you covered in Beginning Statistics Chapter 8.4, Discovering Statistics Chapter 10.7-10.9, and Discovering Business Statistics Chapter 9.6-9.7. Included is a game in which students can draw sample sizes of 20, 50, or 100 and guess the population proportion. After students try the game, we keep track of the chosen sample size, population proportion, and their guesses. This simulation makes understanding how to estimate population proportions easier by making it more of a hands-on activity! Want to see more? Call us at 1-800-426-9538 to request access.
![]()
March 30, 2016
Many concepts in statistics can be hard to grasp for students, especially if...
Read More
Normally, a video helps ring a bell for students trying to commit a lesson to memory. The CreatureCast video below explains the Central Limit Theorem in a fun and easy way to understand. The video applies the concept to measuring bunnies’ weight and dragons’ wingspan. If you’re teaching a beginning statistics course, this video is a great resource to distribute to your students! Click here for more from Minitab’s blog. The New York Times. “Bunnies, Dragons and the ‘Normal’ World: Central Limit Theorem | The New York Times.” Online video clip. YouTube. YouTube, 24 Sept. 2013. Web. 25 Sept. 2015.
![]()
September 25, 2015
Normally, a video helps ring a bell for students trying to commit a lesson to...
Read More